4 steps to getting scenarios running through your Excel model
Here’s a quick guide to running scenarios in Excel, which collects up recent posts that have touched on this topic.
This is your essential guide to making sure your scenarios are running in the best way possible.

(1) Collect up your inputs
Gather up the inputs you want to use to run scenarios in one place.
Perhaps they’ll be listed out in x3 columns (headed high, med, low) with inputs running down the page. Or perhaps they’ll be in x3 rows as per the example below.
(2) Pick out inputs relating to the scenario you want to run
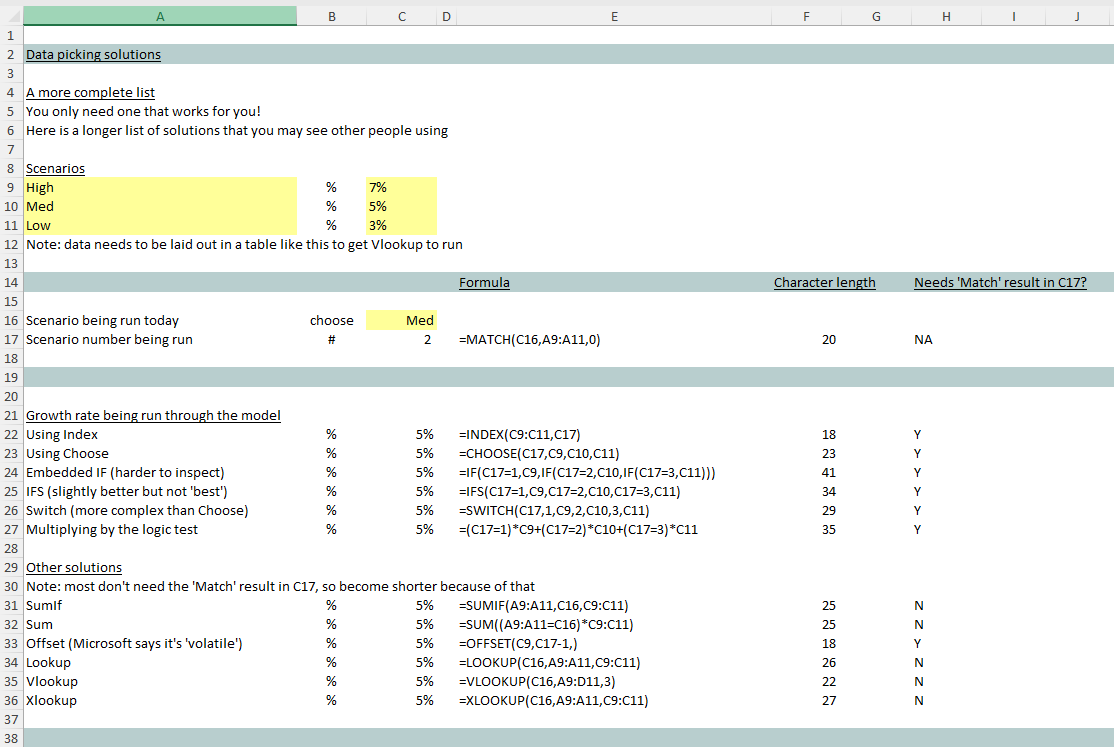
Make use of whatever sits at the top of your list of favourite Excel data picking solutions (the one you use for grabbing hold of a piece of data that sits in a list or a table) and use it to run one of the sets of inputs through your model.
E.g. see the screenshot above where we’re making use of the Choose function in cell C23 to run the 5% growth through the model (all downstream cells that rely on a growth rate would be linked to C23).
There’s more going on in that tiny example than first meets the eye:
- Structuring inputs. The inputs are listed out in rows 9 to 11
- Picking the case that’s running. Cell C16 allows you to nominate one of the scenarios (that cell could use list data validation for added user friendliness)
- Assigning a scenario number. Cell C17 uses the Match function to assign the scenario number
- Getting the right assumption ready to run through the rest of the model. Cell C23 picks the 2nd input out of the list of assumptions C9:C11.
(3) Get the outputs of each scenario displaying next to each other
We recommend a simple VBA macro that repeats what you’d otherwise have to do manually as the best way to getting the outputs of your various scenarios displaying side by side.
That is, a piece of computer code attached to your spreadsheet that flicks the switch (the one that gets each of the scenarios running through your model), and then copies and pastes the key results from each into a table, so you can compare the outputs of one scenario against the other.
(4) Make sure your model is flexing as it should
Make sure your model’s financial statements are talking to each other ‘properly’.
That is, make sure your spreadsheet has the key linkages between the financial statements such that a change in revenue is fully reflected in balance sheet movements (receivables, tax liability, VAT liability, short term funding requirements – which, with its costs, further affects tax) and cash flow. Not all changes in revenue will flow straight through to cash and, when running a new scenario, you need to make sure your Excel spreadsheet is adapting in the right ways.
These posts take you through that:
- A fully flexing structure for your Excel model
- 6 steps to getting your balancing sheet balancing (from the very start of your build).
Further reading
Getting scenarios running (well) is a big – and essential topic! There are better solutions than e.g. making x3 copies of a model and suddenly having to run and maintain multiple versions of a spreadsheet. Running scenarios could likely see you writing a VBA macro (at step 3 above) and really making sure you are on top of balance sheet and cash flow modelling (step 4).
If that’s not quite enough for you, here are a couple of posts that take things further:
- How to run scenarios that incorporate delay e.g. to a contract starting (switching spreadsheet numbers on and off using Excel’s logic test), and
- Discussion around using Excel’s dynamic arrays to flex model scenarios.
Getting scenarios running (well) through an Excel spreadsheet is an art, and a science, all at the same time!
Happy Excel modelling!