Excel Sumproduct's awesome abilities to help you layer up and roll out
Often in financial modelling you want to apply a profile to a set of numbers. Imagine applying a monthly pattern to annual revenue calculations. That example’s pretty easy. You just multiply annual revenue x the proportion of revenue that falls in month 1. With a set of inputs for month 1, 2 and beyond, that’s a pretty simple case.
Applying profiles to source numbers can get a fair bit more complicated than that though.

An example: receipts
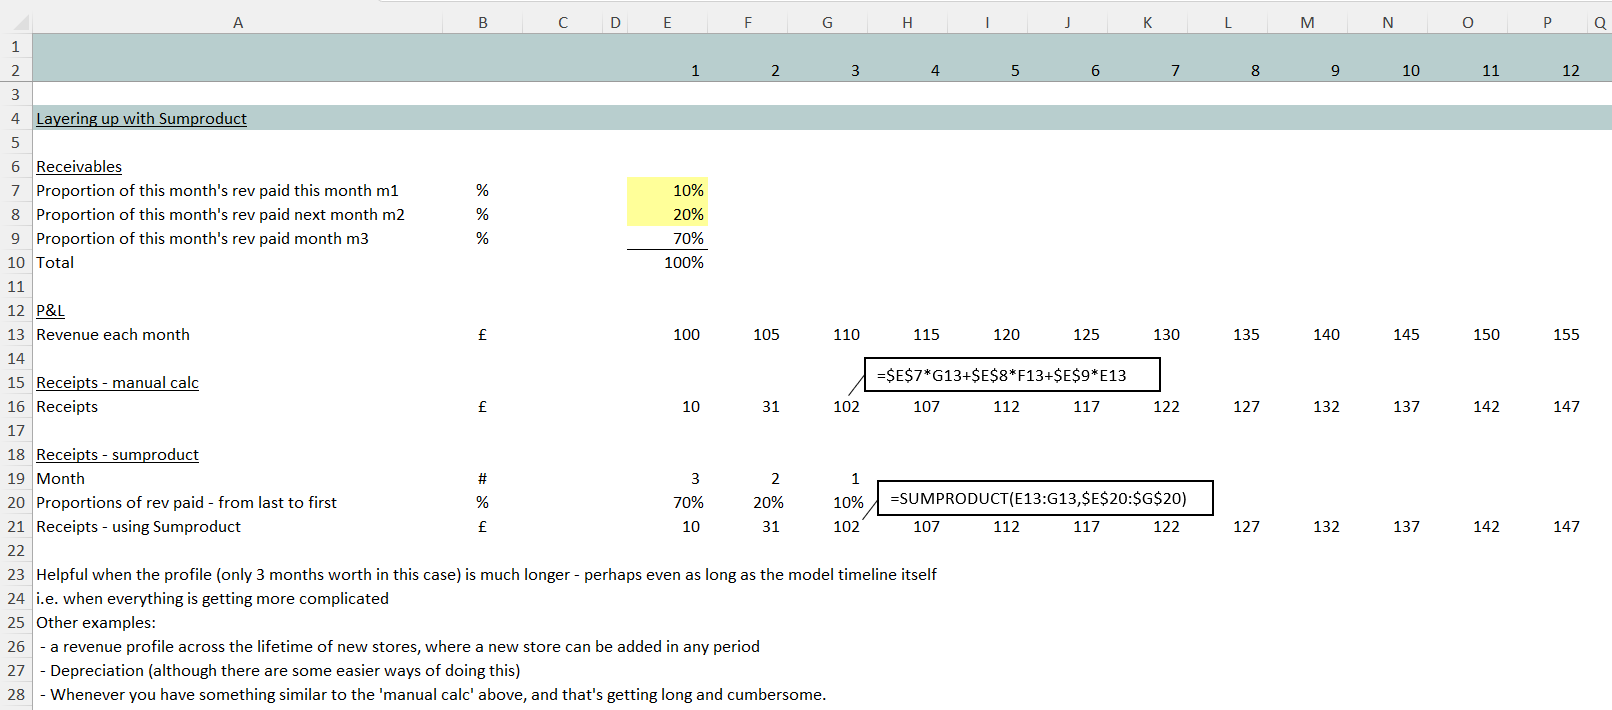
Here’s a more complex example involving receipts. The calculation here takes revenue per month, and then applies an assumption as to how much of that revenue is collected as receipts in the current month (month 1), how much is collected in the next month (month 2) and so on.
Below at row 16 you can see how to wire that calculation manually. But, with a longer-dated profile, that calculation is going to get quite long and complicated. And the formula is going to change along the timeline in the early months.
Sumproduct has something to offer
When applying a profile to a set of numbers, Excel’s Sumproduct function has something to offer. It’s a real super hero of an Excel function.
In the receipts example at row 21, what Sumproduct is going to do is take our revenue figures (row 13) and multiply them by the receipts profile (row20). But there’s a bit of a trick to setting it up – as shown in the screenshot above.
Although it could all be done with a series of manual calculations (row 16), Sumproduct allows us to use a formula that’s got fewer components, and is consistent across the timeline, reducing the chance of a wiring error.
A more complicated example
Imagine you were exploring a roll out of something like new stores. New stores can be added at any point (in the model perhaps you want to experiment with faster and slower roll outs, and the impact on profitability and financing requirements). See row 31 below.
Stores have a revenue profile based on how quickly sales ramp up – see row 34.
Wiring all that up manually (while keeping the whole thing flexible enough to allow you to experiment with fast and slow roll outs) is going to get complicated. But, just like it helped us with a receipts profile, Sumproduct (when set up correctly) can do a great job of layering store ramp up profiles on top of store ramp up profiles.
Below you can see how to get the formula set up. You can see the first store 1 layering in its first revenue in period 3 (G35 with the value of 10). Then it’s joined by a next store in period 6 cell I35. With this structure you can layer in any number of stores at any point in the model, and the formula will adapt.

What’s Sumproduct doing in the example?
Sumproduct’s day job is to take two lists of numbers and multiply them by each other. You can see the first list in the example ($E34:G34 for period 3) but the second is a bit more complicated. That second element of the function makes sure the second list always adapts so it matches the size of the first. That’s what the Index component does – it makes sure the size of the second list adapts along the timeline.
You’ll want this example in your financial modelling toolbox for other types of layering conundrums
You don’t really have to worry about the exact mechanics though – because you’ve got the example here – and you should be able to get it wired up copying the row numbers, data and cell references – adapting it for your own use. It’s a handy thing you’ll want to be able to pull out of your tool box every so often.
Anything that involves layering a profile on top of another profile, where manual calculations become complex, is a candidate for this Sumproduct treatment.
I’ve seen it used for all sorts of things (including depreciation as shown as the example below – but I reckon there are easier ways of doing that – simply because the 20% depreciation rate at line 40 tends to stay constant for those kinds of calculations which means you can use a simpler calculation – as described here: modelling straight line depreciation).

But anywhere that’s got the same kind of layering as the store roll out does, you’ll want to have something like this up your sleeve – giving you the flexibility to play with accelerated or slower ramp ups.
Keep this one in your Excel modelling toolbox folks
Make sure you’ve got something like this one in your Excel financial modelling toolbox. You’ll be glad of it for your ‘layering’ challenges!