Features
The benefit of
simple calculations
Simplifying calculations
If formulas are kept shorter in models, with each formula taking a small step in further-developing a calculation, the logic operation being performed in an individual Excel cell becomes clearer.
Long formulas, with functions perhaps buried within functions, will always be harder to interpret.
Making an effort to keep formulas short makes Excel forecasts easier to unpick and understand.
Breaking complex logic into more steps
If there’s a relatively-complex calculation required to get to a result, our model build process sees us looking to break the formula apart, keeping each formula simple and spreading the logic steps over more lines.
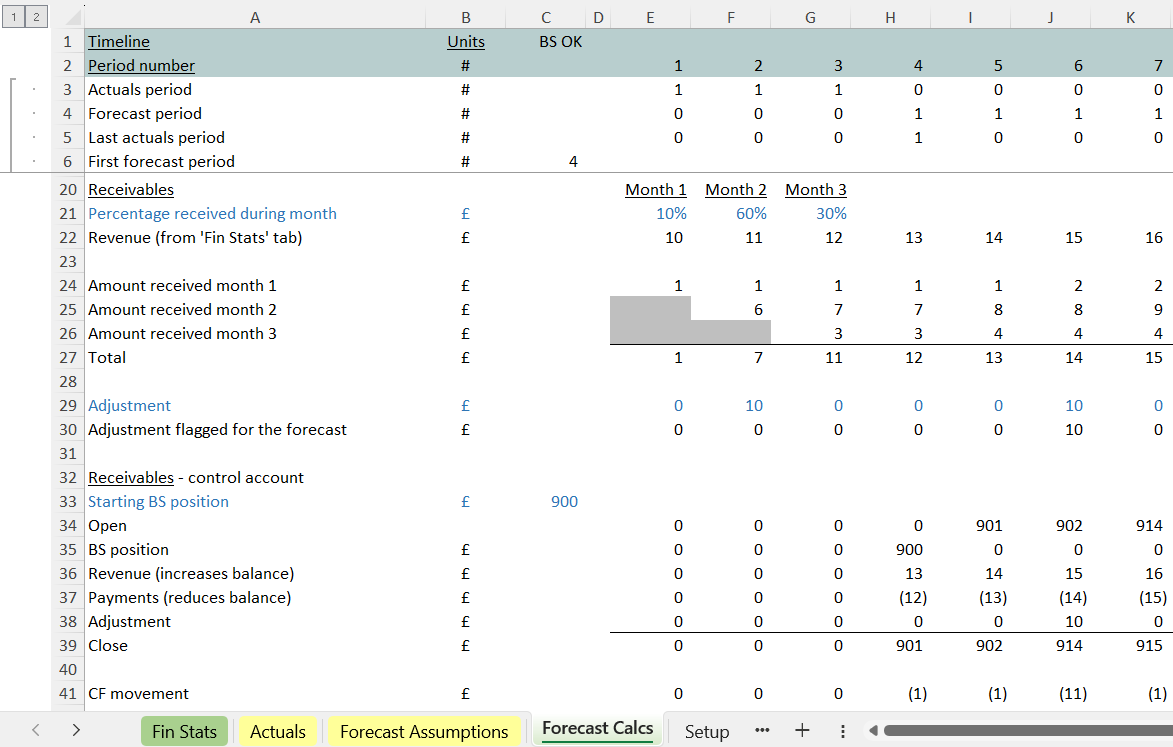
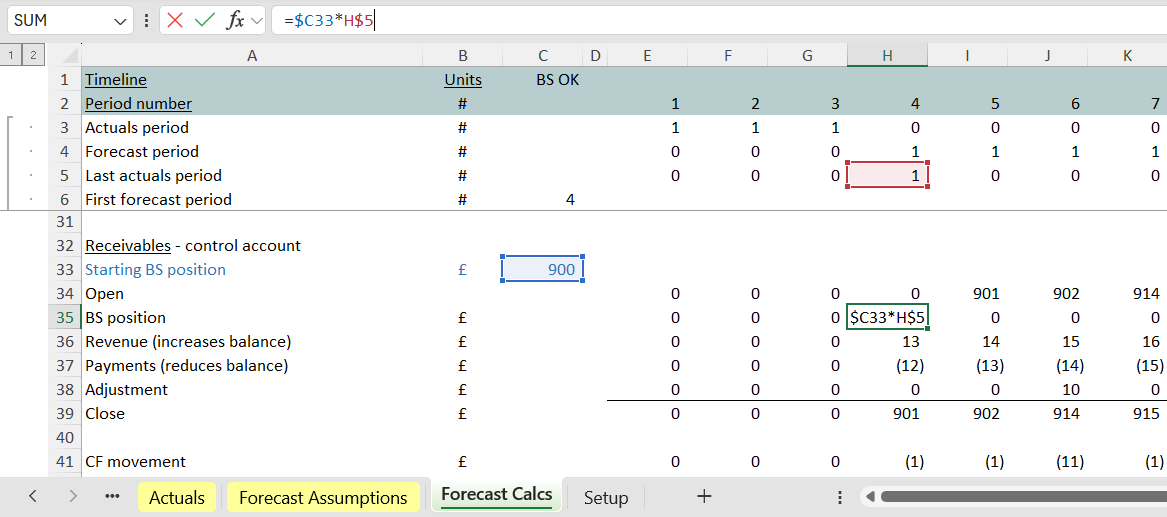
Here below you can see a receivables calculation arriving at line 39. The calculation is built up from the opening position (line 34), and subsequent calculations (lines 35 to 38) each working to modify the receivables balance.
Rather than perform those calculations in one line (39), each is set out on its own line. Each of lines 35 to 38 is itself built up from simple step by step workings in the sections immediately above. For example cash payments at line 37 is a straight-forward link to the figure at line 27, which is itself built up from stepped calculations.
It's a build discipline that requires close and constant attention
‘Simple’ is a real discipline in model building, that takes close attention, thought and work at every twist and turn of a build.
Rather than perhaps taking pride in how many formulas can fit inside each other, the efforts here see calculations stretching down the page, with us always asking how simple that step can be made.
As a result, in building the receivables calculation shown below, the most complex formula in the set is the kind we see for example at line 24, which takes an input figure from line 21 and simply multiplies it by line 24.
It becomes much easier to inspect and understand each ingredient of a calculation that could otherwise start to become more complex.
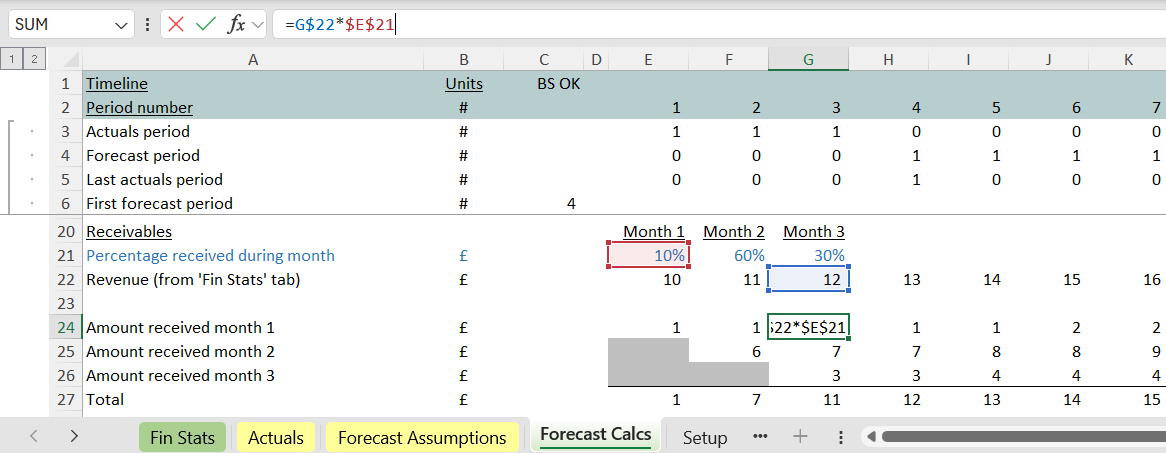
The result is a calculation that takes more space and runs further down the page.
But each Excel sheet available to us contains more than a million rows.
The ‘cost’ (needing to scroll down further to see the complete calculation) is a price worth paying for the greater benefit of improved model transparency.
The art of model structure and the art of formula selection
Excel often gives us multiple ways of solving a problem. For example, when picking a single important data point out of a data set, some people might gravitate towards either a Vlookup, Xlookup, Index (perhaps combined with a Match) or a SumIf.
As well as always asking ourselves whether a logic step in a model could be broken apart and simplified, we also think carefully about which formula to use and how that specific formula choice helps us keep everything in each cell as succinct as possible.
Have a look at the 900 opening figure that’s arriving in its correct position in cell H35 here. “If” we’re in the first forecast period “then” the 900 should appear. If we’re not in the first forecast period then zero should appear. Someone might naturally gravitate towards using Excel’s If formula to recreate that result.
In this model though we’ve thought ahead and made sure cell H35 is simpler than that. It’s 900 multiplied by the switch at line 5.
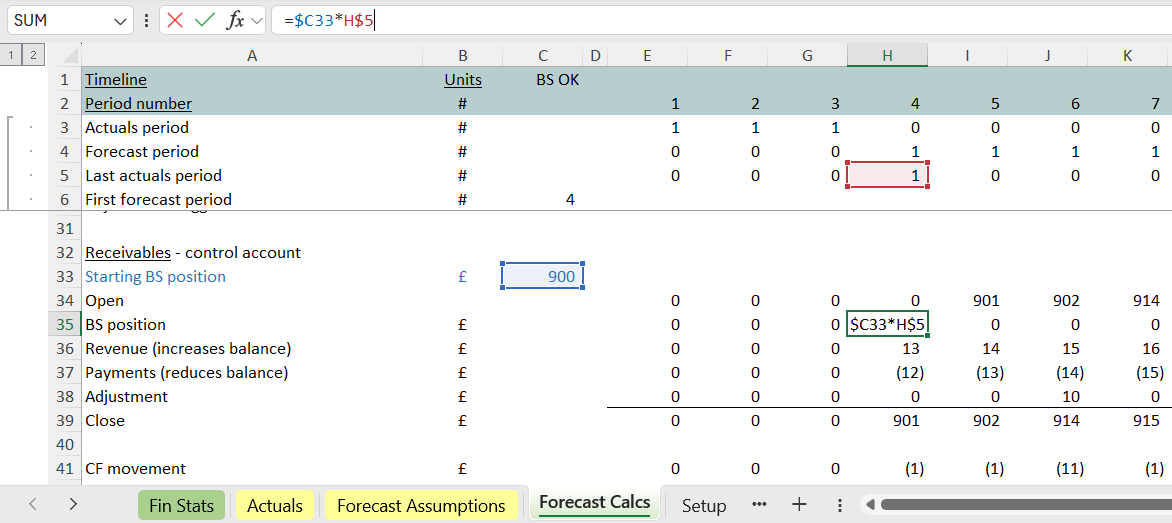
Line 5 in the ‘Forecast Calcs’ is itself a simple link in the model that tracks back to the ‘Setup’ sheet.

Centralising the logic allows us to reduce the number of times a calculation needs to be performed
Rather than build in lots of If formulas sprinkled up and down the model (each of which has to be correct or could later need to be changed), what we’ve done is recognise the repeated need to answer the question “Are we in the first forecast period?”.
We’ve centralised the logic first at the top of each page in line 5 and ultimately, for this model, right back in the ‘Setup’ tab.
Choices about structuring within the model are an opportunity for us to centralise the most-often repeated logic tests.
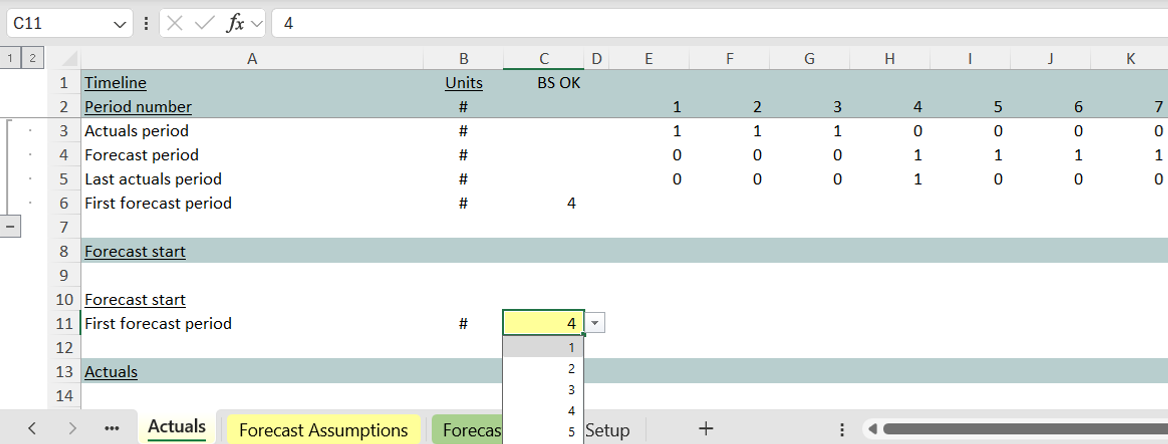
Then, looking at the calculation that’s been picked for the (centralised) logic test in line 5 of the ‘Setup’ tab, even that itself is perhaps simpler than expected. It’s something that’s even simpler than “If” the last period (line 3) was an actuals period, “And” the current period (line 4) was a forecast period, “Then” we’re in the first forecast period.
Notice the simplicity of the formula solution in cell H5.

Centralising the logic makes it easier to run subsequent changes through the model
Here the modellers’ efforts pay dividends. We structure and centralise the model logic around the workings at the top of the ‘Setup’ tab. And we use the very simplest solution our experience leads us to think of for the work that’s being done in cell H5 on the ‘Setup’ tab.
In this case the hard thinking means all the opening balance sheet values can ‘slide’ to the right as we go into a new forecast month, and the model stays balancing when we move from month 4 into month 5
We take great care to make sure the detail of calculations stays simple
It’s this, almost extreme, attention to detail that makes the ultimate fully built-out model easier to inspect and modify:
- individual formulas are selected so they are kept as succinct as possible
- logic is centralised wherever it can be (so operations are concentrated and performed fewer times), and
- calculations are set out in their shortest possible form step by step down the page.
The attention to the detail means it becomes much easier to inspect and understand each ingredient of something that would otherwise start to become complex and more difficult to understand.
