What we can learn from the smallest Excel model - in the world
Today have in front of us the smallest piece of Excel modelling in the world.
It only consists of two tabs.

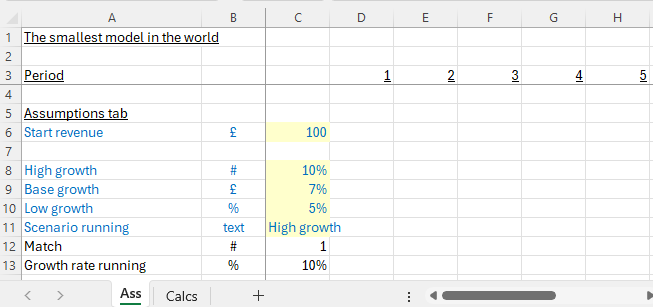
The first tab in our Excel spreadsheet has got some assumptions loaded up on it (it only goes down 13 rows).
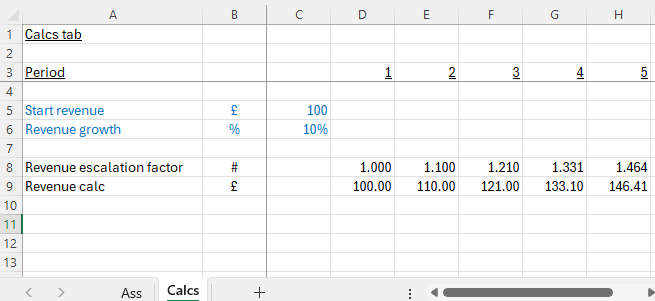
The second tab makes use of those assumptions to produce a very simple revenue forecast. It might be the start of something bigger, but it’s only a start.
Even though the piece of work is tiny, there’s so much about good modelling practices we can see just here. And if those practices are established at the very start, as they are right now, it’ll help make sure the rest of the modelling work is kept clearer, more transparent and less error prone.
Let’s take a closer look at some of the features of what we have in front of us.
Assumptions are centralised
In this piece of work we’ve collected up the main assumptions on one tab. They’re not sprinkled throughout the model. Anything that’s a hard-coded source input for the rest of the model is shaded a particular colour (yellow in this case) so we can see exactly which cells drive the model. Because the assumptions are collected in one place, and shaded, it makes it much easier for someone to operate the model. They can find what they need to change, quickly.
Each line shows units
In column B we’re taking care to attach units to each line item. They’re not all £ amounts. Even in this small example we already have text, percentages, non-currency numbers. In a bigger piece of work it could easily become confusing if we don’t take the trouble to set out the units against each line item.
Each tab has the same structure and timeline
You can see a timeline operating in row 3 on all tabs. On every tab column E is going to contain period 2’s results. On every tab you’re going to find period 3’s results in column F, and so on. The consistent layout makes results easier to find but, because results always sit in the column and time period to which they relate, it makes it easier to get the model wired up correctly. Someone working with the model knows where to find the data they need to manipulate. Someone inspecting the calculations can better see what should be wired to what.
Trying to keep the structure the same on each tab is kind-of about making it easier to find things. But it’s really more about ‘wiring safety’. And then when things are getting bigger and more complicated it also allows us to play a satisfying trick. Imagine we had different entities or business areas, that get modelled in similar ways. Each of those could be on their own tabs. Just keeping the structure the same would enable us to do something very pleasing, which is to insert an extra ‘Consol’ tab which adds all the results up. Using the same structure will mean that the summary tab can now be as simple as =Sum(FirstEntity!D9,SecondEntity!D9,ThirdEntity!D9) and so on – which feels nice and error proof at the point you create the new ‘Consol’ tab. It’s certainly better than having to fish into the bowels of different tabs in different places and draw out the exact number you need each time.
We’ve used freeze panes to lock the top left hand corner of the work
In our teeny tiny example we’ve used Excel freeze panes. On each tab we’ve placed the cursor in C4 and then gone View -> Window -> Freeze Panes. This is part of keeping the layout the same for each tab (someone always knows where to look to find things) but that locked area can be super helpful. You can link it to a key check, like a balance sheet error check, or an overall result for your model (like IRR%). As soon as something goes wrong (e.g. your model starts #REF-ing out, or the result changes drastically) you’ll be able to see straight away.
There’s so much going on, and so much opportunity to get things right, just in the few cells we’ve laid out on the page already. There’s more though. Let’s keep going and take a look at a few more features of what we’re looking at.
The formulas are simple
There’s not much in the way of calculations in this piece of work. Even still, we haven’t been afraid to split a few things out, so each formula becomes shorter. Stepping through calculation logic, in a few rows, enables someone else to see what’s happening at each stage.
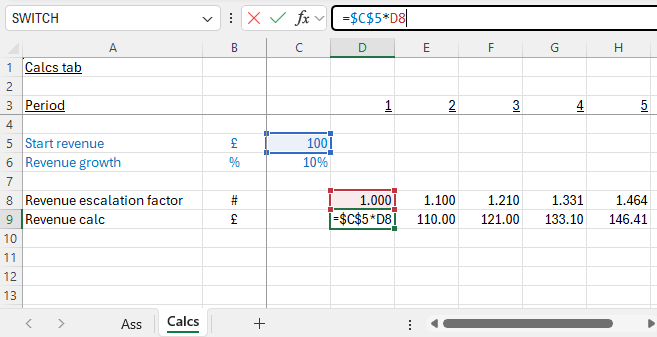
If you’ve been around modelling a while, you’ll know that escalation factors (= indexation) is one of the areas where things can go wrong. How much should something grow by? When should it start growing? What happens to tomorrow’s indexation factor when tomorrow becomes today? And then you’ll often end up finding that a bunch of line items need to grow in the same way. Here we’ve got a first strip of revenue but there could be others about to be built into the model. All that makes it a good idea to strip out indexation and growth rates. It keeps the formulas shorter (every revenue line item is it’s starting point multiplied by the indexation line, rather than growth having to be calculated repeatedly for each revenue line) and it enables someone to see more clearly how the escalation factor itself is growing.
We're importing assumptions
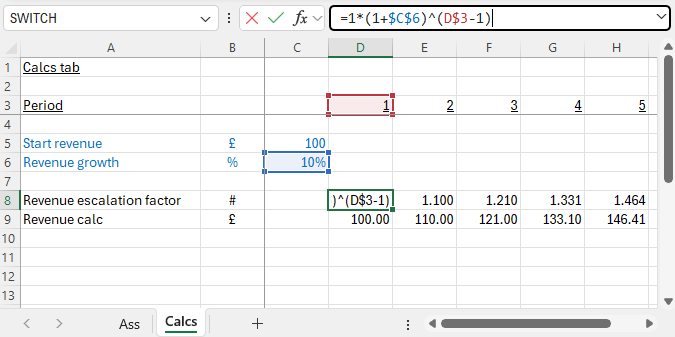
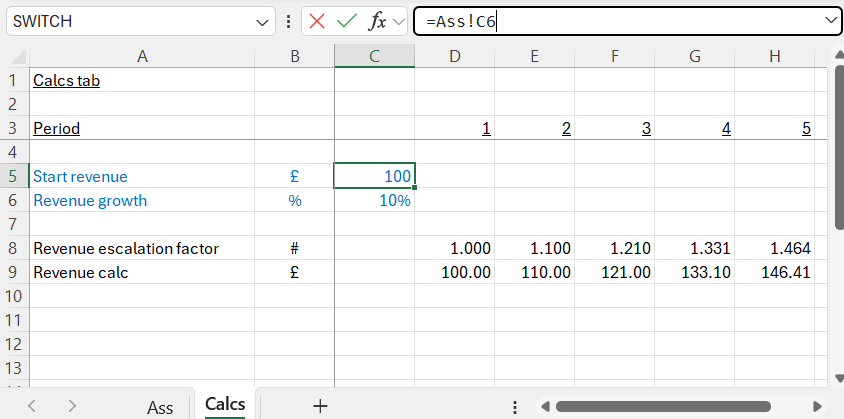
I’d say this is an advanced practice that you’ll come across in professionally built models. It’s a simple practice really. Each calculation starts with ‘importing’ the assumption that’s going to be used as a simple link. You can see that from C5. The blue shaded cells are straight forward links back to the assumptions page. It’s a simple practice to implement, and may seem slightly pedantic and a bit painful at first. It’s just designed to make the model easier to read. When someone looks at the model in rows 5 and 6 they can see: “This section is about manipulating these assumptions”. And then when they click on a black calculation cell, they can see exactly what those assumptions are and how they are being used, without having to trace anything back further. In a big model this becomes really helpful. It’s not really there for the model builder, it’s there for the model reader. If something is easier to read it’s easier to check and becomes ‘safer’.
Here you can read more about the practice of importing assumptions.
We’re all set to run scenarios
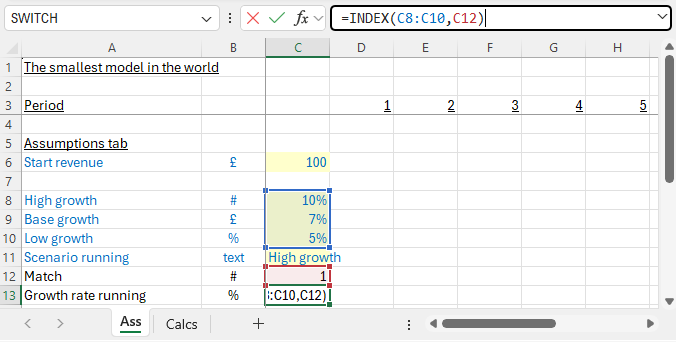
Assumptions are grouped at the front which is really helpful. It’s a first step towards running scenarios because we can stack up a couple of different cases next to our first. You can see that going on in cells C8:C10. Simply clustering assumptions at the front gave us that opportunity. Now that we’ve grouped our assumption sets together, we can develop a switch to throw assumption sets 1, 2, 3 through the model.
The switch that’s operating in cell C11 uses data validation. You can find that under Data -> Data Tools -> Data Validation.
And then we’ve used a favourite (you’ll have your own!) ‘data picking’ solution in cell C13. Everyone needs one of those because, so often Excel asks us to look into a set of cells (C8:C10 here) and suck the correct data point out. Many of us grew up on Vlookup, and perhaps feel we’ve graduated on to something else. You can see what I’ve used at cell C:13. I’m going to be bold enough to say that Index is the one pro modellers like. But everyone has their own favourite and that’s fine. If it works for you and you ‘get it’ that’s fine. There are a whole bunch of data picking solutions operating out there (Excel provides us with an embarrassment of riches in this respect). If you see something unfamiliar going on in someone else’s work (in the data picking department) they’ve probably just got their own pet favourite solution. You can stick to your lane, they can stick to theirs. All is good.
Here you can find coverage of many of the alternative data picking solutions Excel gives us.
There’s so much to get right!
Thinking about it, as soon as we open Excel, there’s so much for us to get right! All of it will serve us well as, inevitably, this piece of (more transparent, less error prone) work grows.
Here already we’ve managed to:
- Centralise and clearly identify assumptions
- Avoid confusion by attaching units to all line items
- Prepare ourselves for running assumption sets side by side, instantly switching them through the model using cell C11
- Adopt the (advanced) practice of importing assumptions as blue cells in the calculations tab, making the model as easy as possible for someone else to read and check
- Keep formulas as short as possible (we have no fear of using a few more lines to break things apart)
- Make our indexation factors and growth rates clear, centralising those in one place so other downstream lines can make use of them (rather than have to recalculate them)
- Put a consistent timeline in place, and make sure each tab has the same structure across the top wherever possible. Someone knows where to look to find things. If it’s easier to find things it’s going to be easier to wire them up or have that wiring checked.
Now, with these practices under our belt (can we call them the basics? Because so often it seems some of them are easily forgotten!) we’re ready to go ahead to build out the rest of the model. Putting these practices in place from the start will make sure the work we’re producing is clearer as it goes on, easier for someone else to follow, and just plain safer!


