What can we learn from the 2nd smallest Excel forecast in the world?
Recently we were looking at the sorts of things that you want kept straight in an Excel spreadsheet, right from the very start (when we were reviewing the smallest Excel financial model in the world). There we were thinking about things that might seem basic (like centralising assumptions) but become problematic if work goes too far forward without paying attention to them.
And after that we were looking at some of the things that provide you with initial indications as to whether a piece of work could be potentially sound or probably problematic (see 5 things I’d look for in Excel forecasts). Things like a proper balance sheet check, financial statements talking to each other, and decent working capital treatment.
Today we’re looking at the practicalities of getting all that together in one place – so the ‘5 things’ boxes are absolutely ticked. If you scroll the content below you’ll notice that someone can take their forecast functionality a lot further ahead by just paying attention to a few key lines and links. The model template below is tiny. But if someone has those few features in place (psst: much better to have them in from the start as the build proceeds) they’ll have added a lot of extra functionality into their work.
The trick is to think ahead, realise that what we’re talking about here is required, and get it all in place early on (as per the example template structure below).
Let’s have a look at a few features (that are already in this, the 2nd smallest model in the world) that are going to achieve a fair amount for us – right from the very start.

This model sees the financial statements talking to each other ‘properly’
Sure it’s got (A) profit and loss modelling (that’s normal) starting from row 11.
And it’s producing (B) cash flow (using the P&L’s EBITDA line to start that – see row 30).
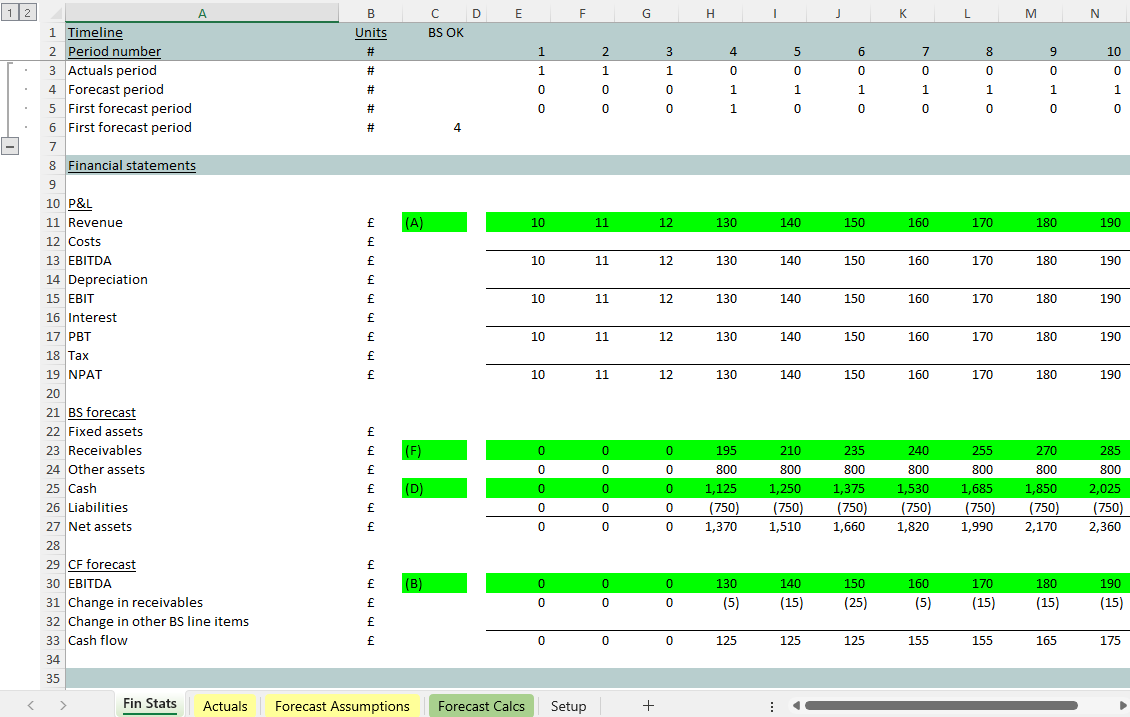
Then it’s looking at what happens (C) as cash flow mounts up (see the cumulative/ running total on the ‘Forecast Calcs’ sheet at line 45) and bringing that on to the balance sheet at line 25 on the ‘Fin Stats’.

You can see the balance sheet laid out from line 21 on the ‘Fin Stats’ tab. We’ve got room for forecast assets (starting at line 24) and liabilities starting at row 26. Cash has arrived at (D) line 25 as a direct link from the cumulative total of cash that’s being produced at the bottom of the cash flow statement. At line 27 on the balance sheet we look up the balance sheet to give us a first reading on net assets (= equity = shareholders’ funds = accumulated retained earnings).

The (crucial) 'proper' balance sheet check
Crucially, as well as looking up the balance sheet (for a total of our forecast of assets, cash and liabilities) this piece of work is producing a 2nd reading on that total.
There are some workings on the ‘Forecast Calcs’ tab that allow us to compare the #1 reading on the balance sheet (forecast assets less forecast liabilities) against the evolution of bottom-line profits. Accountants know that this year’s equity = last year’s equity plus this year’s profits. That’s what that #2 reading at line 56 (E) is doing below.
If the 1st and 2nd readings on balance sheet equity match, then we can be more confident that there’s some integrity about the links between the cash flow statements and that the movements we see laid out in the balance sheet really are being reflected in cash flow.
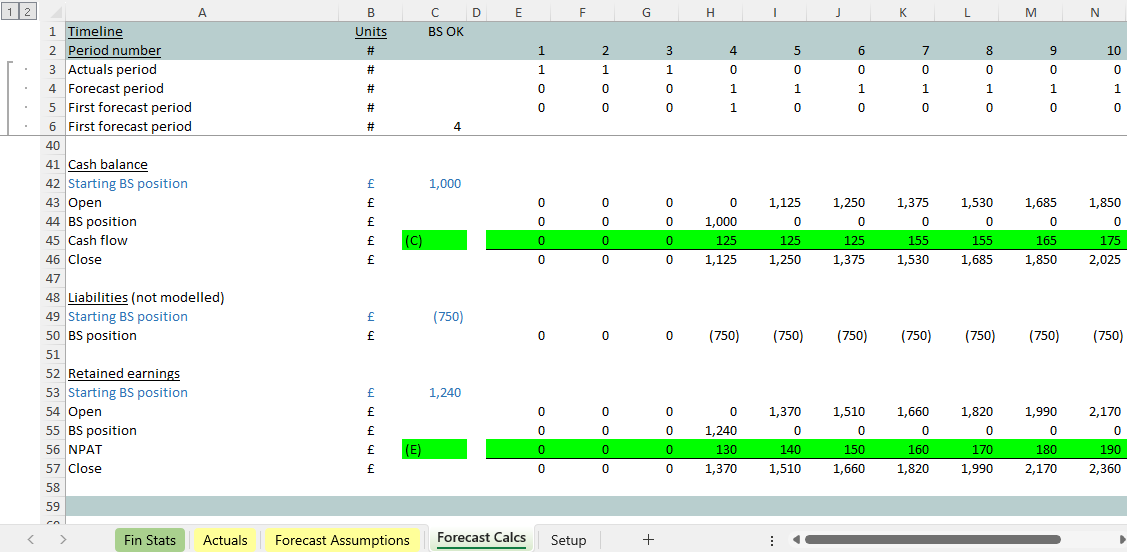
With just the #1 reading (looking up the balance sheet line 27 ‘Fin Stats’), without the #2 reading (line 57 ‘Forecast Calcs’), we could have missed or double counted a movement.
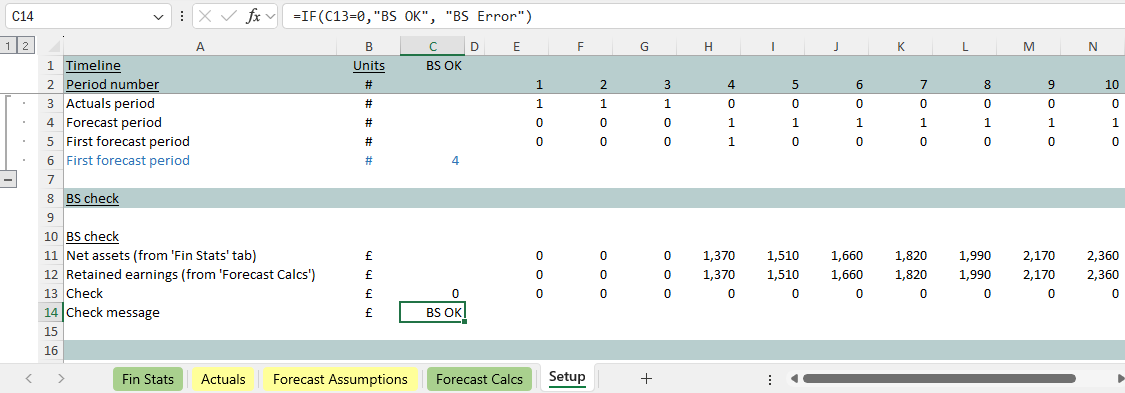
You can see on the ‘Setup’ tab we’ve got a check that #1 and #2 match. A check message arrives at cell C14 and then makes it up into C1 on all tabs. As soon as we do something to the model which introduces a (temporary) balance sheet error, we’ll know about it very quickly.
The 2nd smallest model in the world has got the beginnings of working capital modelling
You can see that this very small model has got a fair amount packed into one place – the sorts of things you might someone might want to get right, from the start of a build.
You can see some forecasting around receivables starting at line 16. The receivables days assumption being used is obvious to us at line 17 (see “centralising and importing assumptions”). The calculation at line 20 takes revenue and applies the receivables days assumption.
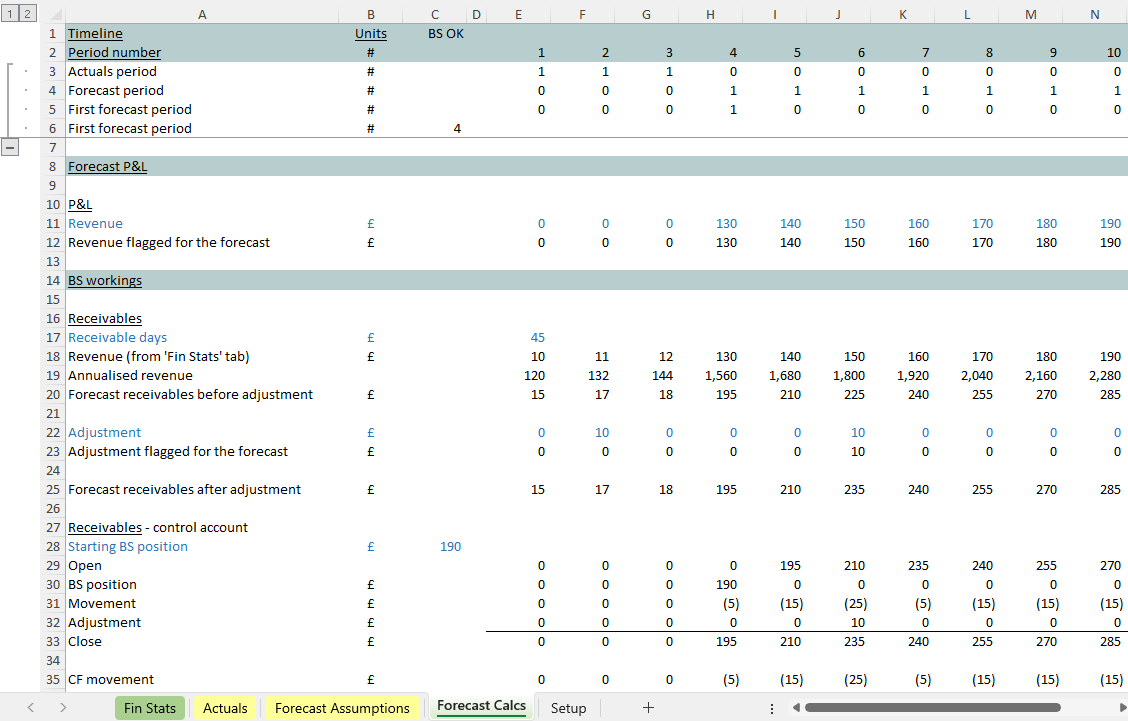
Then all the movements in the receivables balance are laid out (step by step) from line 27 above in a ‘control account’. Helpfully our closing balance sheet position for receivables is sitting at the bottom of the control account at line 33. The associated cash flow movement is sitting under that at line 35. These are two crucial lines for our financial statements and sticking to this layout means we always know where to find them ahead of wiring them into the forecast.
On the ‘Fin Stats’ receivables has been brought into the balance sheet at line 23 (F). You can see the associated cash flow movement which has been brought into line 31. At this point in our build work, nothing has been left out or missed, and we’ve got the balance sheet check (sitting up in cell C1) that shows all’s OK.

What happens when we layer in a new balance sheet line item
Now we’re in a good place with this build work. It’s ready for any next balance sheet line item to be forecast. I’d hope to see the movements set out in a control account for that new amount, with the closing amount sitting at the bottom. Then it becomes easy to calculate the cash flow movement under that. It’s just what we did with receivables.
As we wire the new balance sheet line item in (we did that at line 23 with receivables on ‘Fin Stats’) we can expect the balance sheet error to ‘fire’, telling us that we’re only half way there. Next, as we wire in the cash flow movement (as we did with receivables at line 31 ‘Fin Stats’) the balance sheet should fall back into line.
With the balance sheet check in place (from the start) we can keep an eye on things as we go. This is much better than trying to get your balance sheet to balance at the end of the build. At that point you could have a number of mistakes (you don’t yet know about) interacting with each other.
Putting the balance sheet check in early is a much safer way to proceed.
A 6 step guide to doing this all for yourself
Here are 6 steps that will help you get a template like this together so your balance sheet balancing from the very start of your build. Getting a few key linkages in place from the start will help you make sure that the cash flow impact of all balance sheet movements is reflected in cash flow. And you won’t have to worry about getting your balance sheet balancing at the end, because you will have made sure it’s balancing at the beginning and stays that way all the way through your build work.
Look at what happens in this template when a new month arrives
Notice the timeline being used at the top. This (the 2nd simplest model in the world) has got a slightly more involved timeline. Notice the rows of 1s starting from H4. When a month advances, we can change cell B11 and the formulas at line 4 will see all those 1s shuffle to the right. They’re switches. When the month changes to 5 H16 will open up and turn yellow (Excel’s conditional formatting helps us with that) creating room for recent actuals.
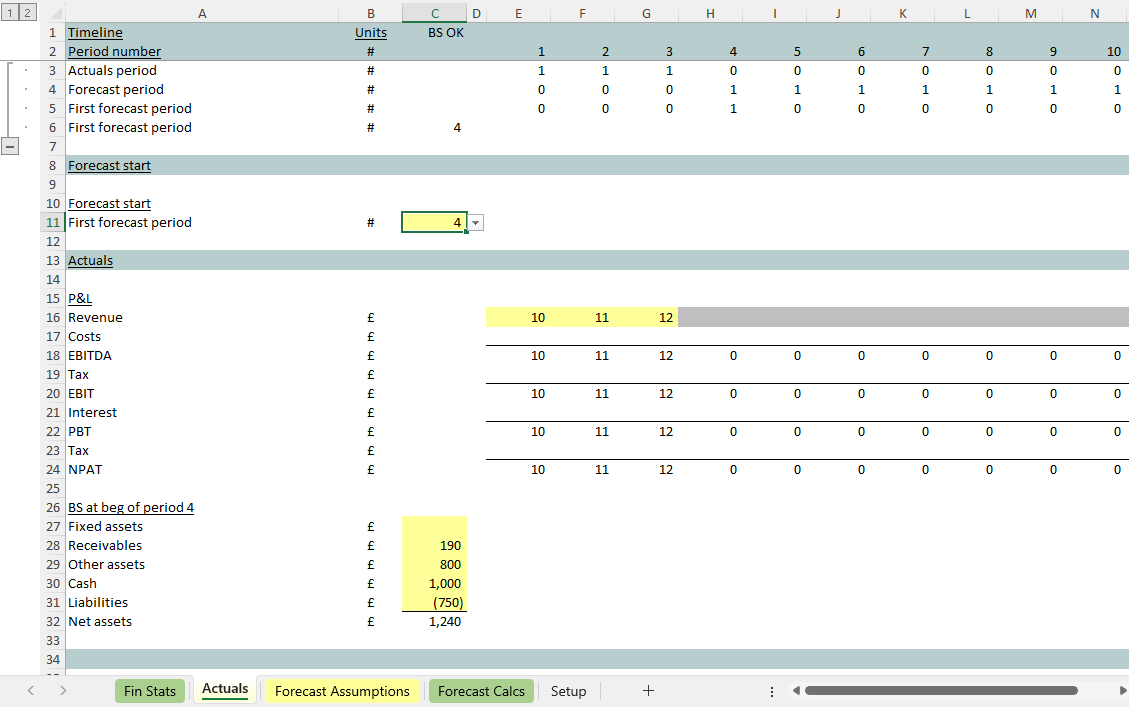
Under this structure actuals are stored as their own layer in the template. This is a lot better than the alternative of working new hard-code actuals directly into the ‘Forecast Calcs’ tab, having to remember exactly what you have to overwrite.
The ‘Fin Stats’ use the switches in the timeline, and a very simple formula, to create a ‘sandwich’ from the actuals plus the forecast. In actuals periods the ‘Fin Stats’ bring in the numbers stored on the ‘Actuals’ sheet. In forecast periods numbers arrive from the ‘Forecast Calcs’. The switching is centralised at the top of the model so there doesn’t need to be anything complicated about the formula that’s producing our rolling actuals + forecast results.
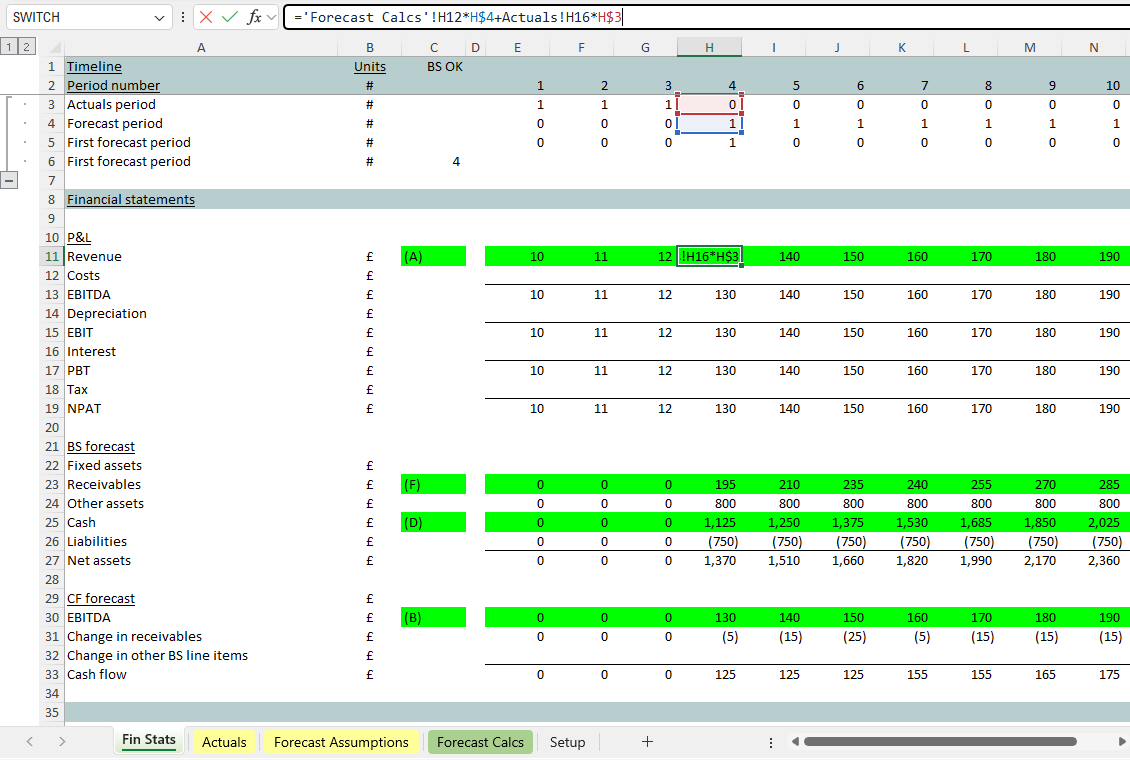
You can read more about this mechanism here: easy update model structure. But it’s already in place in the few lines we have together in this little template (added at the start as part of the design). It’s designed to make it safer and easier to roll forward the forecast when a next month passes.
Adapting the model for the most recent balance sheet
Notice there’s room for the latest balance sheet at the bottom of the ‘Actuals’ tab.

You can see each element of the opening balance sheet arriving in each control account starting at line 28 below. The switches at the top of the model will mean that, when we’ve moved ahead one month, all of the opening numbers in the control account will shuffle one to the right. The balance sheet forecast always starts with the latest historic balance sheet figure. All of this is designed to make sure the balance sheet stays balancing even when a month has advanced and next period’s forecast has become this period’s actual.

There’s a lot going on here!
OK it’s a small template model with a few key links in place illustrating the fact that, with a little forethought, a lot of extra functionality can be added to your work (just by making use of some compact workings).
Yes it’s covering some of the basics (like the smallest Excel model in the world did). But there’s a lot more in this (also small) one. This one has:
- A smart timeline operating throughout that’s running key switches
- Actuals held in their own layer, so there’s no confusion about where to place the latest figures (and no need to overwrite calculations with hard codes, which is just dangerous)
- Room opening up for recent actuals at the flick of a switch, with room for the new balance sheet to slot into the correct place, and the balance sheet check staying true as you roll the forecast forward
- Financial statements interacting in a way that gives someone inspecting the work confidence that all movements associated with all the balance sheet line items laid out on the page really are going to be reflected in cash flow
- Some sensible working capital modelling, with the steps involved very clearly laid out and presented using the balance sheet ‘control accounts’ you can see above
- Key linkages that make sure the balance sheet check stays true throughout the build work (as you add more detail to the forecast). Sorting out the balance sheet check doesn’t have to be something that gets laboured over at the end.
Even in just a relatively few calculations, there’s so much to think about, and so much to get right! But this article gives you the structure and template format for that. It doesn’t have to be bewildering. It’s all doable – starting by getting a few key Excel formulas in place, and maintaining those as the work proceeds.


