Features
Intelligent
dashboarding

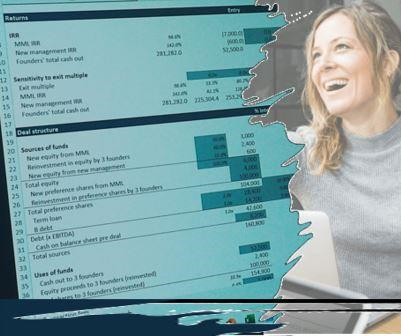
Important results are collected at the top of the model so you can see the impact of changes
If we view the model as having a ‘pyramid’ structure, with the work being done by the model in its calculations part of the base of the structure, right at the top what we’re doing for you is collecting up the most important results of the forecast.
Within our model structures we very clearly separate inputs. That enables the user to find what they want to change (e.g. revenue inputs) and, with key inputs resting at the top of the model structure, quickly see the impact of what they have just changed.
Working with you to present the right information at the very top of the model
In the interests of clarity of communication, less is often more when it comes to dashboarding, avoiding the risk that the user of the model ends up suffering from information overload.
We work closely with you to establish exactly what you would like to see portrayed in the dashboard of the model – focussing down on the results that you see as most important.
For example it could be that perhaps highlighting the variance forecast vs. actuals, or latest forecast vs. budget is something of primary importance.
It could be that outputs should match the format used for internal reporting, so that results from the model can be quickly copied and pasted into regular reports without any further manipulation required.
Each project is different and each dashboard build is an iterative phase that sees you and us co-operating together to make sure the right results are reflected in the right place.
