Displaying scenario outputs side by side
Let’s imagine you’ve got scenario sets nicely laid out in your model and switching through absolutely fine.

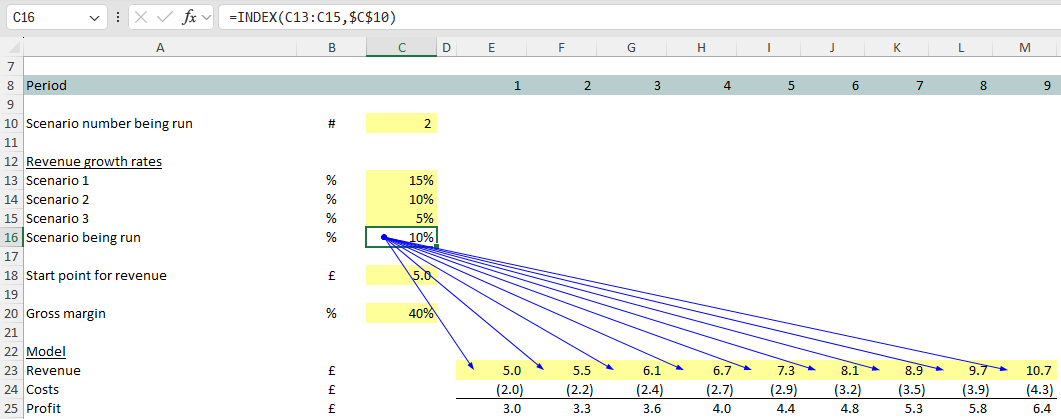
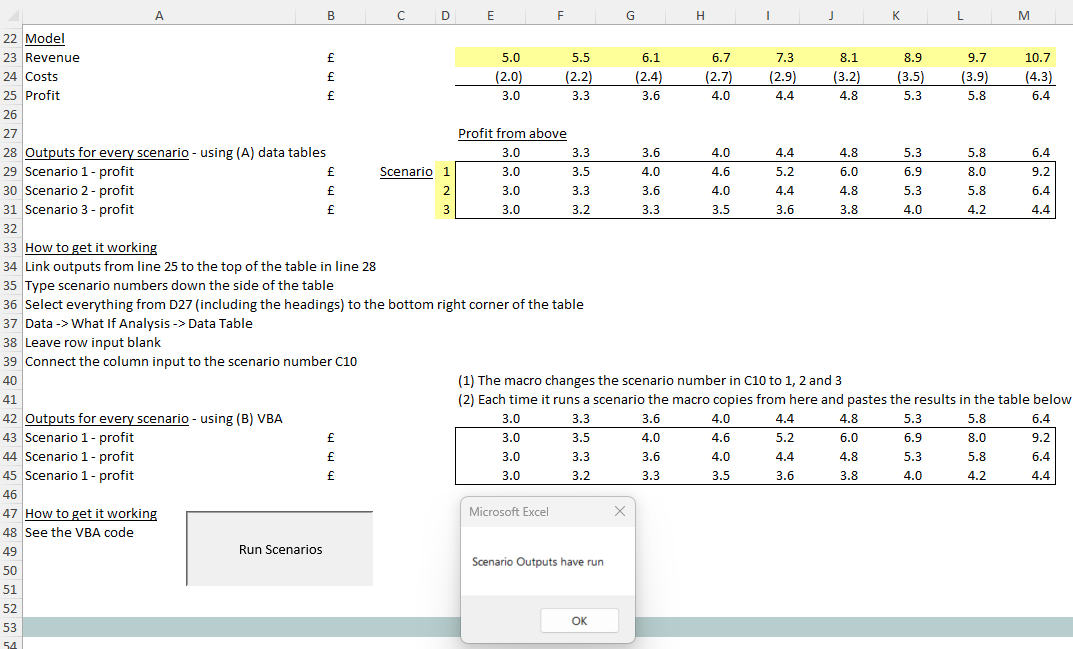
Now you’ve got the challenge of how to display the results of scenarios 1, 2, and 3 side by side – when the model only runs one scenario at a time (with the switch in cell C10 below being changed through 1, 2 and 3 for each).
The draw backs of creating copies of the Excel model
To make sure you’ve got a run of each scenario 1, 2&3, you could be tempted to copy out your model three times, either within the same workbook or as whole copies of the existing workbook file.
The problem with that arises when you’re asked to make a change to the model. Now it has to be done in each of the three copies – correctly – in all the right places. Tripling the model triples the risk that changes might inadvertently be made inconsistently in each (especially if it’s a big model).
There are a couple of good alternatives which mean you can get the outputs of each scenario displaying side by side inside the one model. Let’s have a look at those options now.
Using a single variable data table
Here’s the first option – and the instructions for setting that up for the example below:
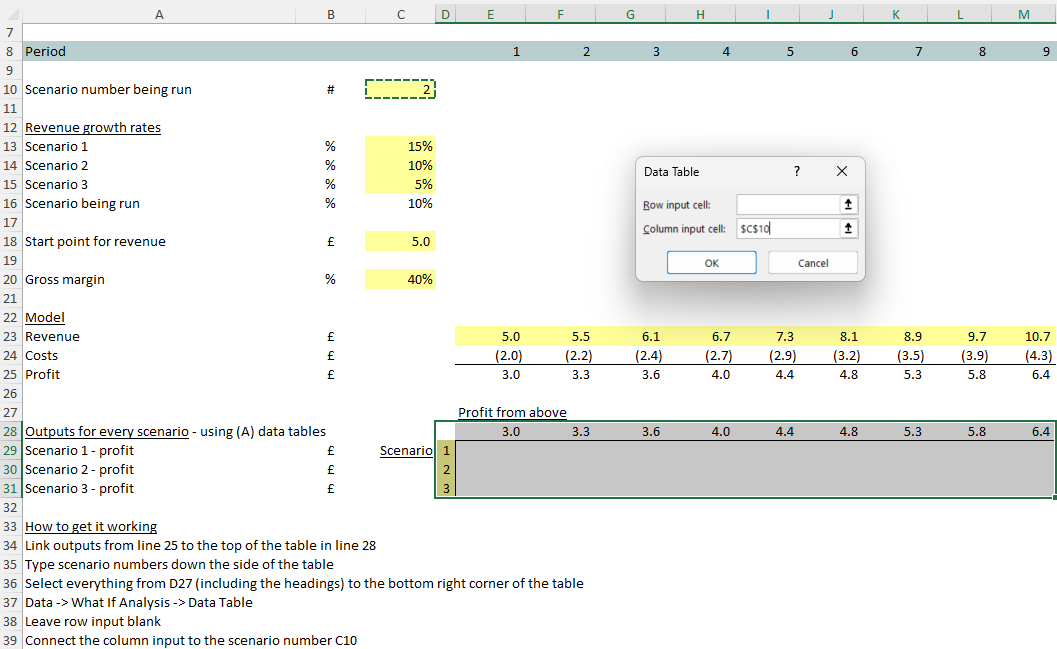
- Link the outputs of the model shown at line 25 to the top of the table in line 28.

- Type in the scenario numbers down the side of the table.

- Select the whole table area as shown below, including the headings
- From your menu items go Data -> What If Analysis -> Data Table
- Leave the row input blank. Hook the column input up to the scenario number C10.
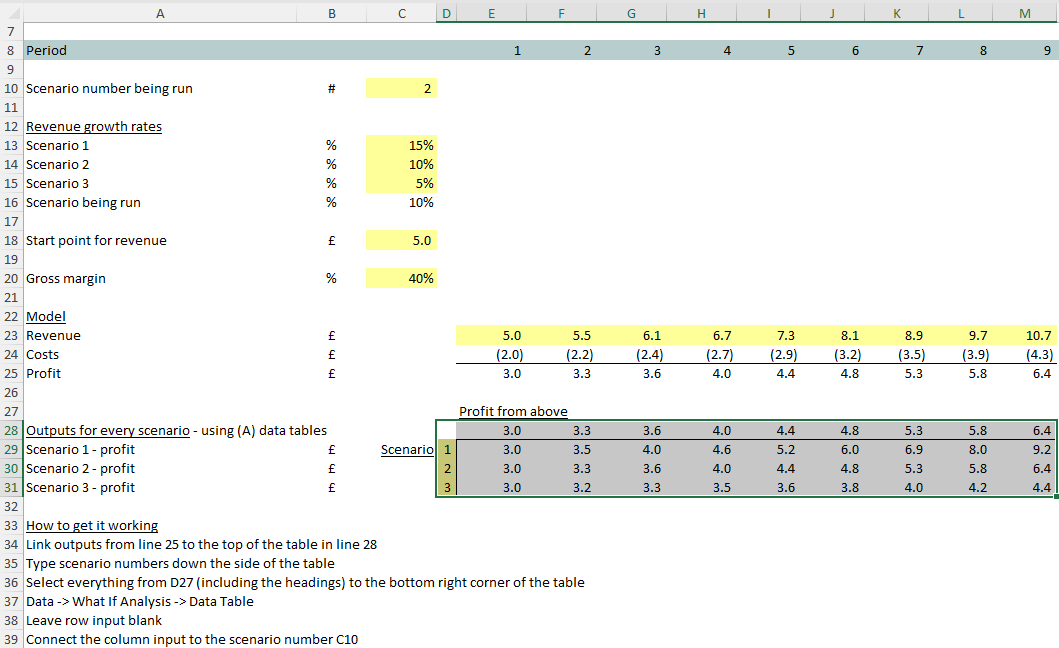
- The table should populate with the results of the three scenarios.
Data tables: the draw back
The issue with data tables is that they continuously run, are memory hungry, and can place a load on your spreadsheet.
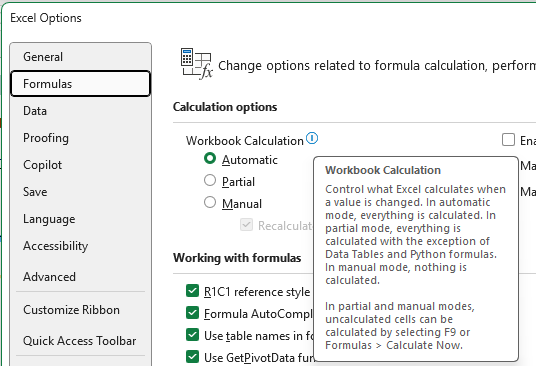
Even Excel knows this – that’s why you can see this very subtle message deep in the options. Here Excel gives us the choice of switching to “Partial” calculation which switches off automatic calculation of data tables. That’s because data tables are resource hungry.
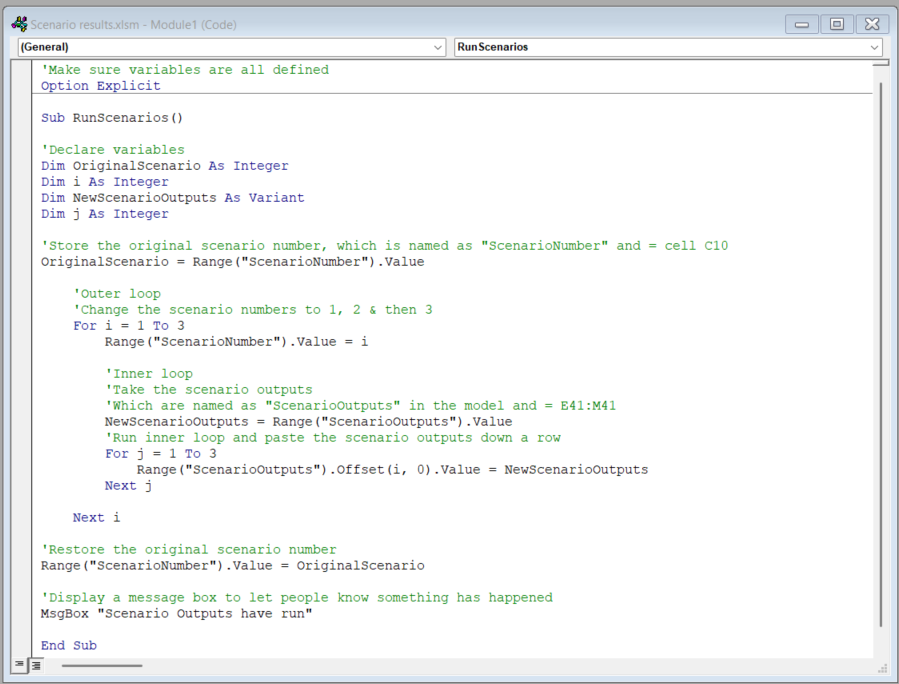
Instead of data tables you can run a tiny piece of VBA macro code
Data tables place a continuous load on your spreadsheet that can get heavy. So here’s a second option that puts a “Run scenarios” button into your model that only (briefly) forces the spreadsheet to calculate after you decide to press the button.
The code replicates a process you would otherwise feel obliged to perform manually. The code changes the scenario switch (1, 2, 3) and each time it takes a copy of the model outputs and pastes them into a table.
There are better solutions than multiple copies of models
After doing a whole heap of work to build a beautiful Excel model, working (nicely) with scenarios in place, the last trap someone wants to fall into is creating multiple copies of a model. That’s going to triple any future work and it’s going to triple the chance of an error being made.
Thankfully, right at the end of your build work, you do have a couple of choices – which aren’t too tricky to implement (provided you know about them of course!). Then you can give yourself a well-deserved pat on the back for getting your scenarios set up, switching, with the results displaying next to each other – all as elegantly as possible. Congratulations!


