Excel's formula auditing tools
In our last blog post we looked at how you could structure models to make it quicker and easier to trace through them, mostly just by using the “Ctrl [” keyboard shortcut.
But what if the model’s not Nirvana? Not all real-life models are constructed as carefully as we do here. That means you’ll likely want to make of Excel’s formula auditing tools to find your way through the tangle.

Where to find Excel formula auditing
To find Excel’s formula auditing tools, first find the “Formulas” menu tab and look for “Formula Auditing” (towards the right as shown below).

The features you’re probably going to make the most use of are “Trace Precedents” and then also “Trace Dependents”.
In the example below we’ve clicked on “Trace Precedents” for cell C14, which results in a bunch of blue arrows popping up in the model. Click on the blue arrows and they’ll take you to the precedents on the current Excel sheet.
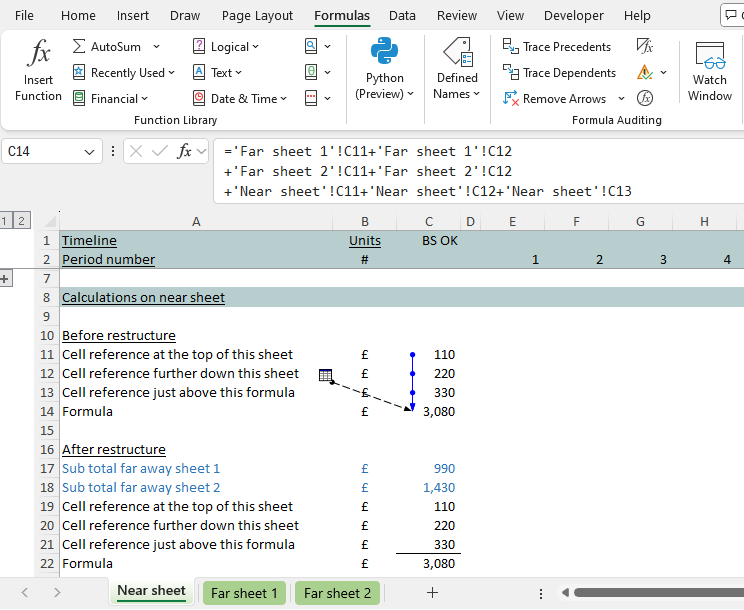
Click on the blue arrows again and you’ll get back to where you started.
Double click on any dotted arrows and those ones will take you to the precedents (or dependents) on far away Excel sheets.
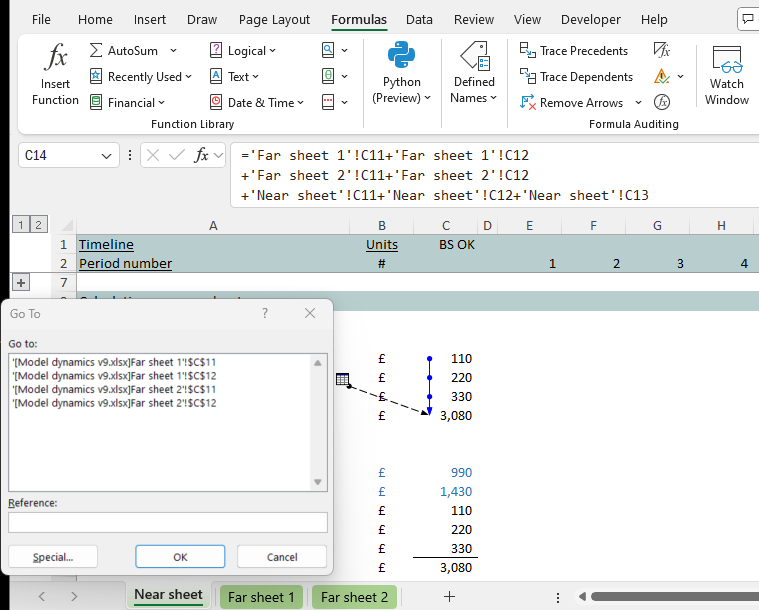
After you’ve clicked on the arrows, press “F5” followed by “Enter” (one at a time, taking your finger off “F5” before you press “Enter”) to jump back to where you first started.
Shortcuts for precedents and dependents
If you have to do a lot of tracing, and prefer to use your keyboard to access formula auditing (as opposed to using your mouse to click through the menu items), press “Alt” on your keyboard. Take your fingers off and press “M”. Now you’re on “Formulas” and can see what you might want to press next (maybe “P” for precedent formulas).
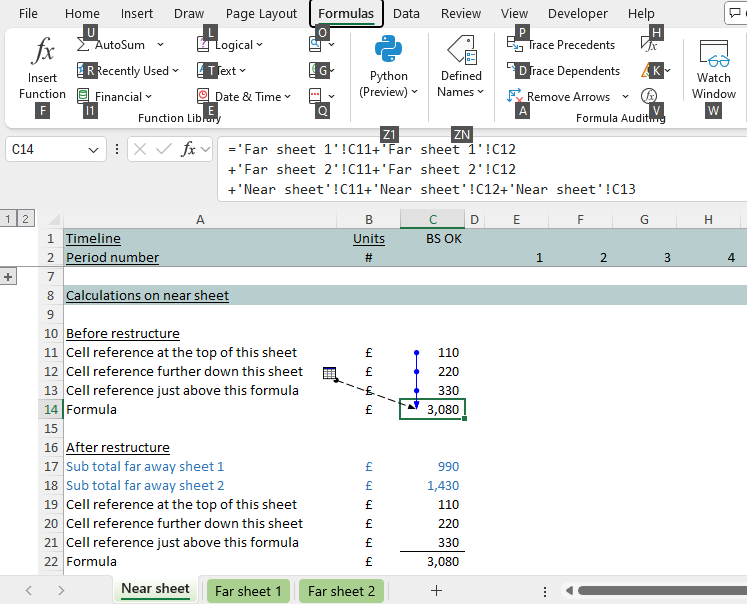
“Alt” followed by “M” and then “P” becomes the shortcut for trace precedents. “Alt” “M” “D” for dependents.
Remember you have to press these keys one at a time taking your fingers completely off the keyboard before you next press.
The most essential Excel formula auditing keyboard shortcuts
For formula auditing we’d recommend familiarising yourself with:
- “Ctrl [” for the first precedent
- “Alt” “M” “P” (one at a time) for trace precedents; and
- “Alt” “M” “D” for trace dependents.
And then combining the above with “F5” “Enter” (one at a time) to jump back to where you started.
Those ones are essential for making the job of tracing models easier.
Tracing through Excel modelling work is fun!
Tracing through Excel models can be fun! At least it is when the model has been well designed, the person who built it knew about and took account of the concept of ‘flow’ (top to bottom, left to right, with the logic reading like a book), and bothered to construct the formulas to aid clarity – with the side benefit that you can sit there hitting “Ctrl [” followed by “F5” and “Enter” super quickly.
Otherwise the whole exercise becomes similar to untangling a Flymo extention cord during the Saturday morning lawn mowing. That’s the one where the job of untangling the extension cord takes longer and becomes a bigger achievement than mowing the lawn itself!