The great benefit of control accounts for Excel financial modelling
One of the things that can quickly make Excel models impenetrable to a new user (along with things like spaghetti and unusual non-standard financial modelling practices) is long and embedded formulas.

An easy fix for long complex Excel formulas
This one can be such an easy fix! All you have to do is break any long formula into steps using a few more rows or columns.
As a measure of how standard the practice is (of breaking formulas into their component steps), here we talk about “control accounts”. It’s common enough that we have a code word for it!
Others talk about “corkscrews”. They’re the same thing. If, for example, a formula is working to modify a number each period, what we do is bring the starting position into the top row. Subsequent rows modify that number. The bottom row is a total (starting plus modifications equals ending). Then the current period’s ending position gets transferred to the top of the next new period as its starting position, and so on.
Perhaps you can see why it’ s a ‘corkscrew’? It goes round and round, always forward.
Corkscrews make Excel modelling easier to trace
If you haven’t heard of control accounts or corkscrews before, the practice could strike you as somewhat pedantic. But, when you’re reviewing others’ models, having calculations set out as corkscrews is far more valuable to the person inspecting the work (than say the opposite habit of seeing how complex a solution can be developed inside one cell).
Corkscrews/ control accounts are a simple, and great, tool for improving the transparency of models.
An example control account
Imagine you were modelling receivables. One approach might see an attempt to model that in one or a very few lines. But when you’re looking at the receivables balance as at the end of a month, very quickly this calculation can become complicated.
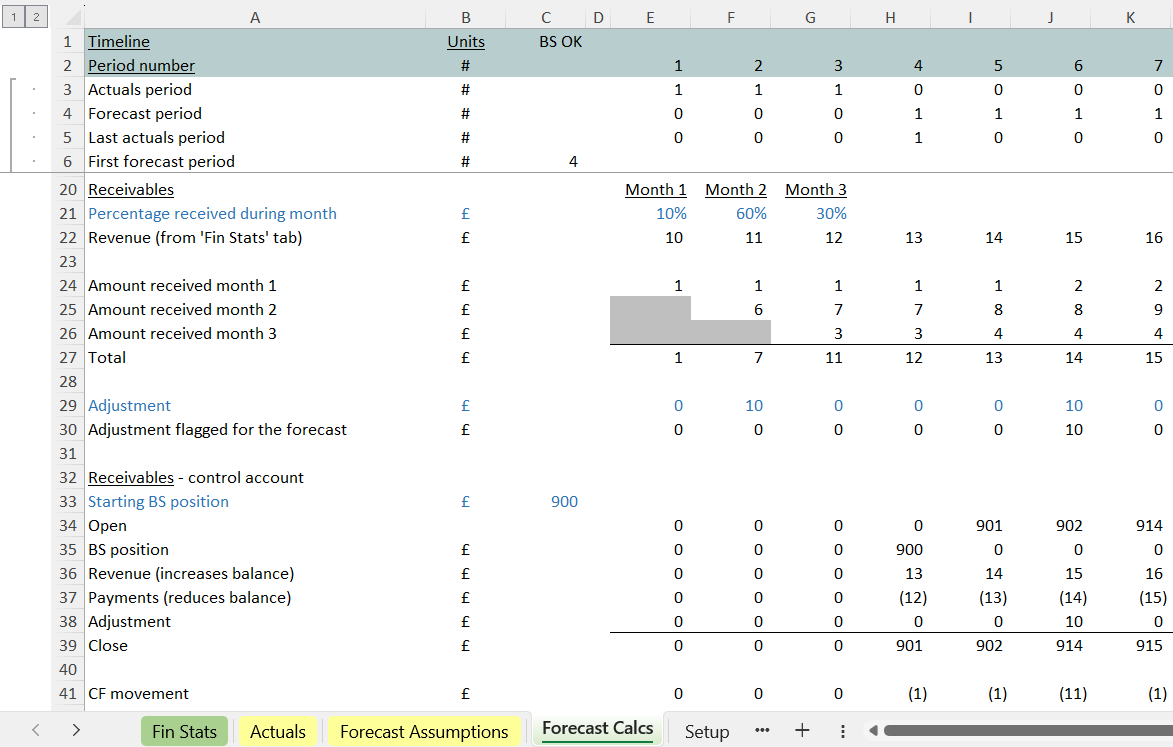
So, for receivables you could start with the opening position in the top row (line 34). The next rows each contain the movements that impact receivables up or down. Then on the bottom row 39 you have the receivables position at the end of the month.
That’s all definitely much clearer than sandwiching everything into one row. Remember we have one million plus rows in Excel, and any model that uses a significant proportion of them will soon be groaning under its own weight. So the advice is to make use of the rows Excel gives us freely and with abandon.
In general, someone makes things worse (if not for them, for the person looking at the work for the first time) by trying to economise on the number of rows used. Rows don’t need to be saved as much as transparency needs to be created.

Getting your balance sheet balancing - every time
Remember the modelling for receivables we were talking about a moment ago? There we’ve got receivables for the period at the bottom of the control account and we’ve listed all the changes that get us to that position. That bottom position gets linked straight into the balance sheet on the ‘Fin Stats’ tab in one of our models.
Underneath the control account what we do is separate out the cash flow movement associated with the balance sheet line item (line 41). So in one place we’ve got the balance sheet item itself (at the bottom of the control account) and also, straight underneath, we’ve got the movement that needs to be sitting on the cash flow forecast in the ”Fin Stats’.
Control accounts become a great aid in getting the wiring correct for the forecast financial statements – making sure no balance sheet item is missed or double counted – and making sure all the cash flows associated with those balance sheet movements are picked up.
Control accounts (along with a proper balance sheet check) are a great tool to help keep your balance sheet balancing, and in making models clearer.


